Overview
We have enhanced the Campaign Performance Prediction experience with two new capabilities: line item-level prediction curves for DV360 campaigns and baseline prediction curve visibility across all supported platforms.
Since targeting decisions in DV360 are now made primarily at the Line Item level, providing prediction curves at the same level enables more actionable forecasting and optimisation insights.
These enhancements provide deeper forecasting insights and make it easier to understand how prediction accuracy evolves as actual campaign performance data becomes available.
What’s New
Line Item-Level Prediction Curves for DV360 Campaigns
- Prediction curves are now available at the Line Item level in addition to the existing Insertion Order level for DV360 campaigns.
- Users can select a specific line item from the corresponding dropdown to view its prediction curve. When All Line Items is selected, the prediction chart will continue to display forecasts at the insertion order level.
Baseline Prediction Curve
- Users can now view the initial prediction curve generated before campaign delivery began.
- Previously, once a campaign started running, prediction curves were continuously refined using actual delivery data, making it difficult to compare current forecasts against the initial prediction. This enhancement addresses that gap by allowing both views to be compared.
- Once enabled, an additional dotted-line curve will be displayed on the chart representing the baseline prediction, allowing users to easily compare the original forecast with the latest prediction
- This capability is available for campaigns across all supported platforms.
Benefits
- Analyze forecasts at a more granular line item level, aligning with the latest DV360 targeting settings
- Compare original forecasts with continuously updated predictions
- Better understand how prediction accuracy improves over time
- Gain deeper visibility into campaign delivery trends and forecast adjustments
Getting Started
- Navigate to the Automation -> Explore and click on View Prediction from Actions against the campaign you want to analyze
- For DV360 campaigns, use the Select Line Item dropdown to view predictions for a specific line item
- Select All Line Items to view insertion order-level predictions
- Enable Show Baseline to display the initial prediction curve alongside the latest prediction
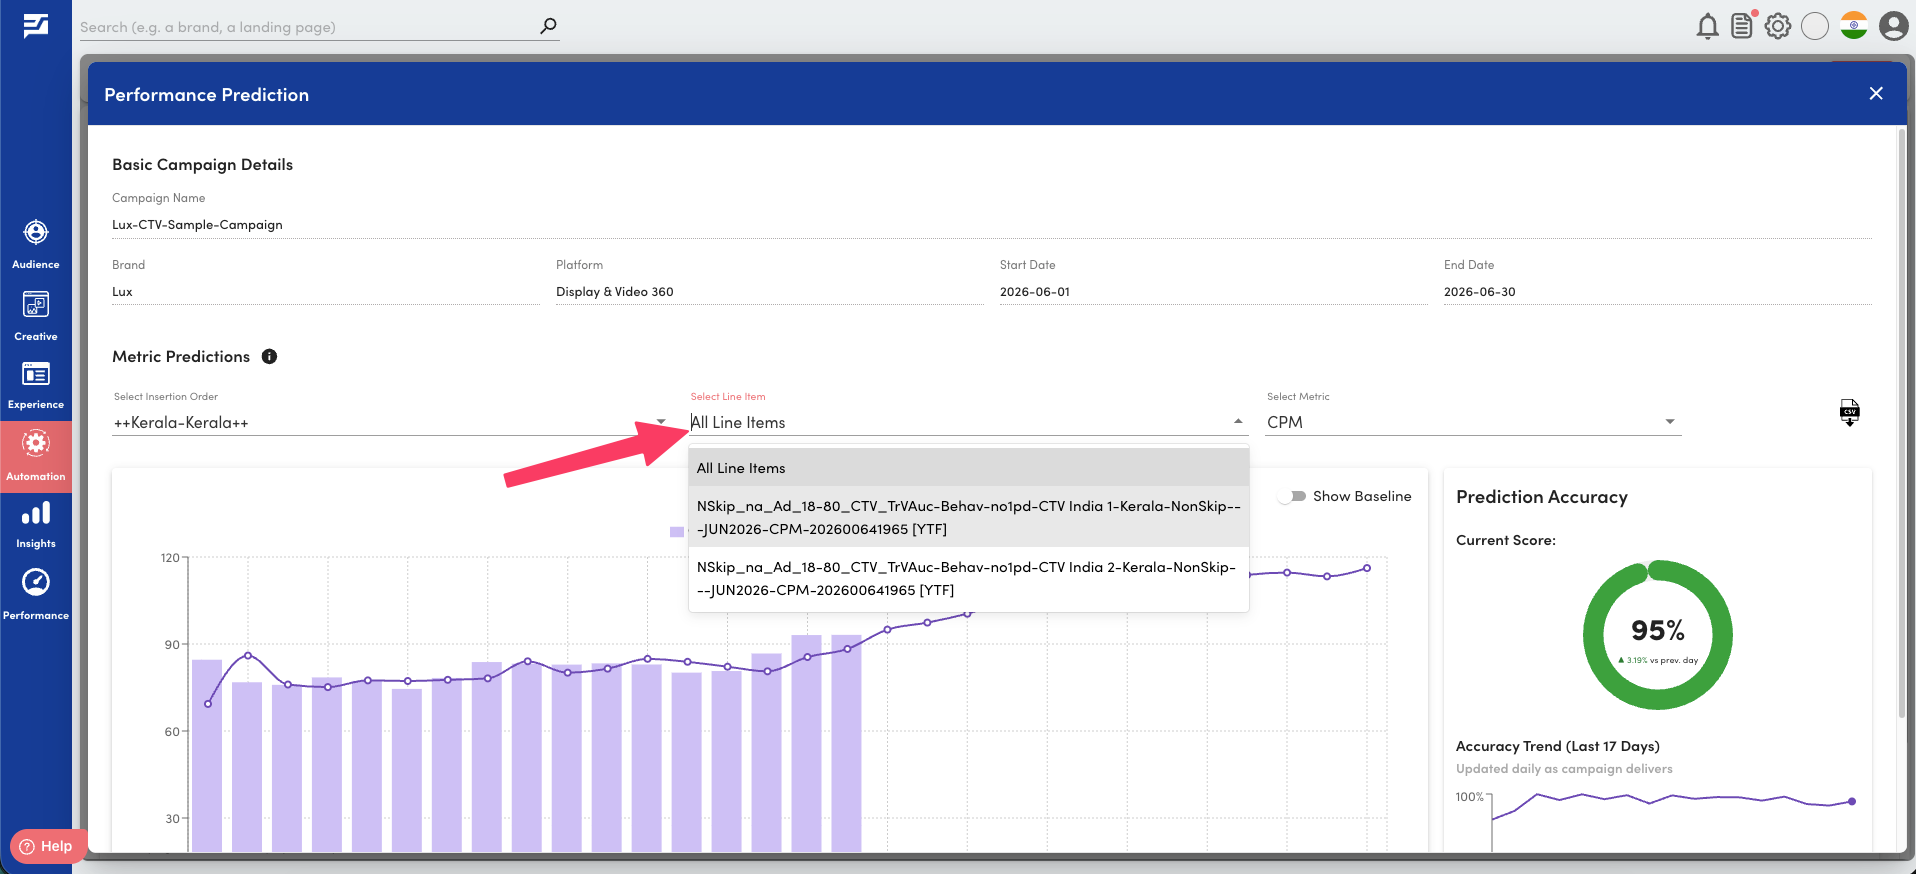
Line Item-Level Predictions
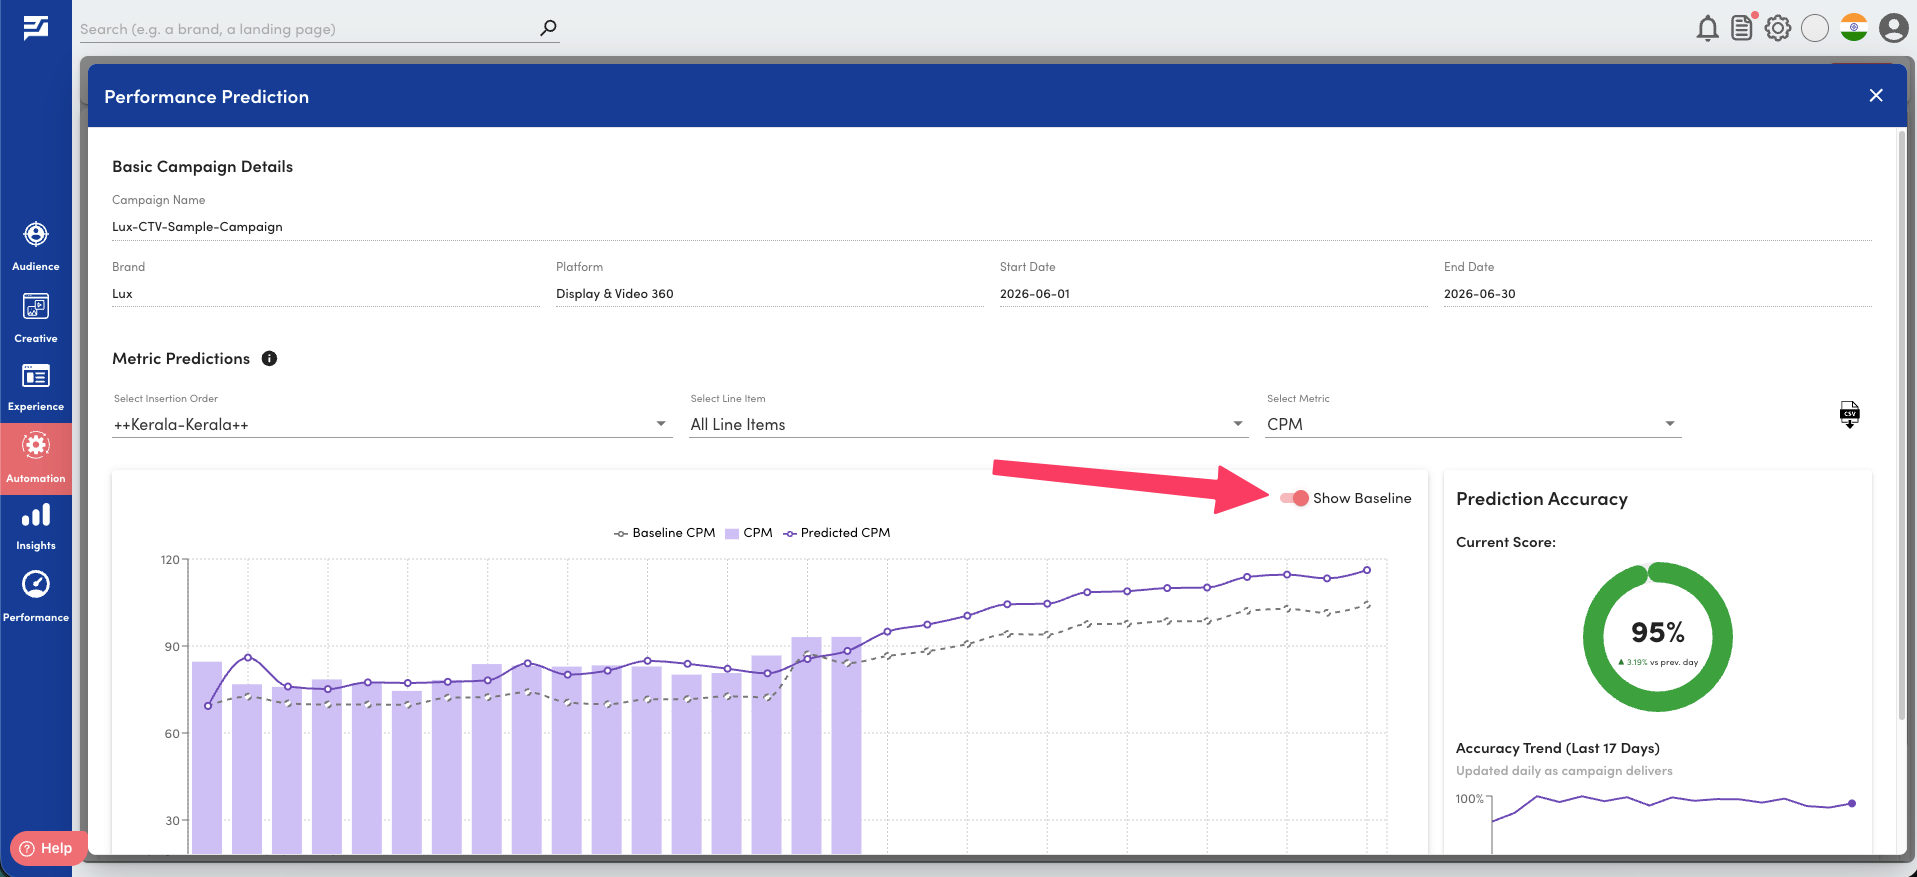
Baseline Prediction